
Google Analytics 4 (GA4) is the latest version of the popular web analytics platform that offers many new features and capabilities for online marketers and website owners. However, GA4 also comes with some challenges and changes that require careful attention and testing. We will help you overcome these challenging by discussing various advanced techniques to debug Magento 2 Google Analytics 4.
One of the most important aspects of GA4 implementation and maintenance is debugging. Debugging is the process of finding and fixing errors or issues in your GA4 configuration, tracking, or reporting. Debugging can help you ensure that your GA4 data is accurate, complete, and reliable.
But how do you debug GA4 effectively and efficiently? What tools and techniques can you use to verify and validate your GA4 setup? In this blog post, we will show you how to use the DebugView report in GA4, Real-time reports, debugging with console, GTM Preview mode as well as some other helpful tips and tricks for debugging GA4 like a pro.
What is DebugView in GA4?
DebugView is a built-in report in GA4 that allows you to monitor the incoming data from your website in real time. DebugView shows you the events, parameters, user properties, and error messages that are sent to your GA4 property by your tracking code.
DebugView is useful for debugging GA4 because it lets you:
• Check if your tracking code is installed and working correctly
• Verify if your events, parameters, and user properties are configured and named correctly
• Identify any errors or warnings in your data collection or processing
• Test and troubleshoot your custom events, conversions, audiences, etc.
• Compare the data from different devices or platforms
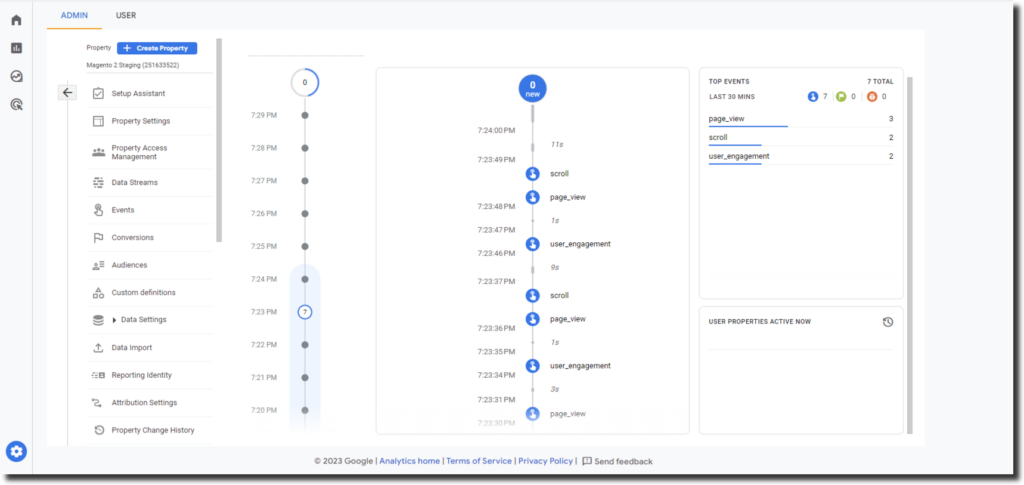
How to Enable DebugView in GA4?
To use DebugView in GA4, you need to enable it on your website. There are different ways to enable DebugView depending on your method of tracking.
For Websites
If you are tracking your website with GA4, you have three options to enable DebugView:
• Use the Google Analytics Debugger Chrome Extension
• Use the Google Tag Manager Preview Mode
• Use the debug_mode event parameter
Option 1: Use the Google Analytics Debugger Chrome Extension
The Google Analytics Debugger Chrome Extension is a browser extension that adds a debug_mode parameter to all the requests sent to GA4. This parameter tells GA4 to display the data in DebugView.
To use this option, follow these steps:
- Install the Google Analytics Debugger Chrome Extension from here.
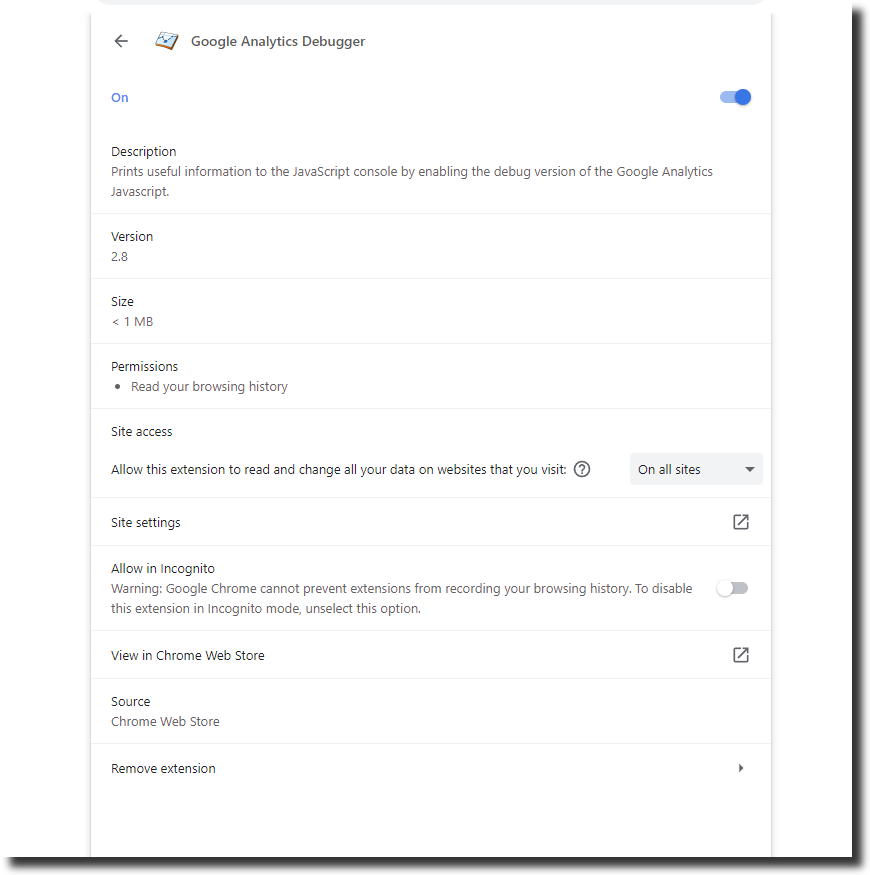
- Click on the extension icon to enable it (you should see an ON ribbon).

- Navigate to your website and interact with it as a normal user.
- Go to your GA4 property and click on Admin > DebugView from the left menu.
- You should see your events coming into DebugView in real time.
Option 2: Use the Google Tag Manager Preview Mode
The Google Tag Manager Preview Mode is a feature of Google Tag Manager (GTM) that allows you to test your tags before publishing them. If you are using GTM to implement GA4 on your website, you can use the Preview Mode to enable DebugView.
To use this option, follow these steps:
- Go to your GTM account and select the container that contains your GA4 tag.
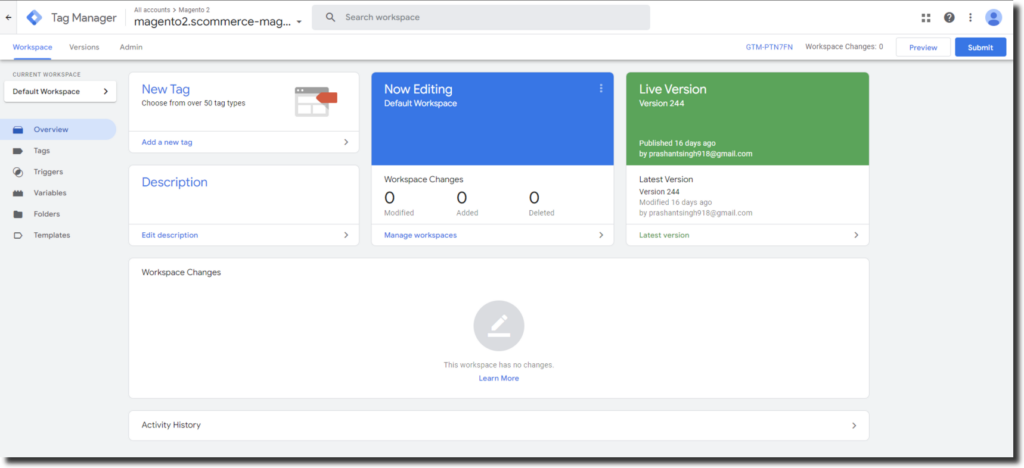
- Click on Preview from the top right corner.
- A new tab will open with a GTM debug console at the bottom.
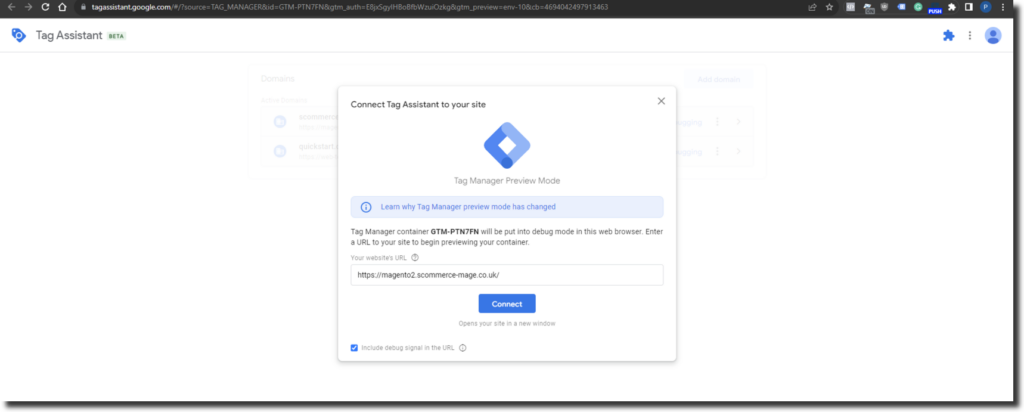
- Navigate to your website in the same browser and interact with it as a normal user.
- Go to your GA4 property and click on Admin > DebugView from the left menu.
- You should see your events coming into DebugView in real time.
Option 3: Use the debug_mode event parameter
The debug_mode event parameter is a custom parameter that you can add to any event that you want to display in DebugView. This parameter tells GA4 to display the event in DebugView regardless of whether you have enabled any of the previous options.
To use this option, follow these steps:
- Add the debug_mode parameter with a value of 1 to any event that you want to display in DebugView. For example, if you are using gtag.js to send an event called purchase, you can add the debug_mode parameter like this:
gtag('event', 'purchase', {
'debug_mode': 1,
// other parameters
});
- If you are using GTM then modify the tags to include the parameter ‘debug_mode’ ‘True’ to see events in the DebugView.
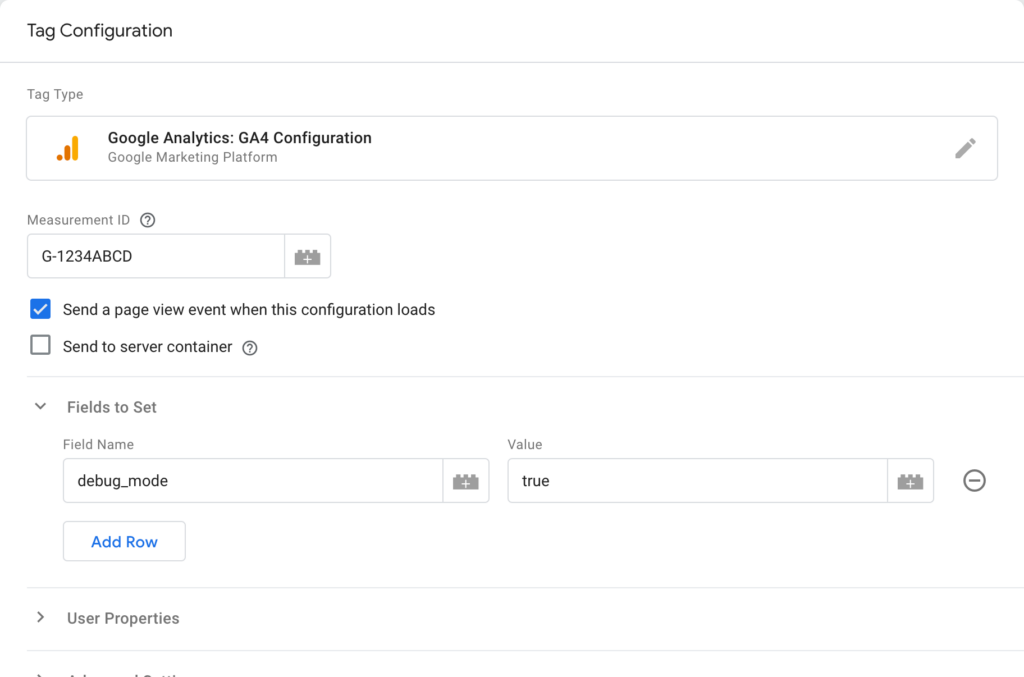
- Navigate to your website and trigger the event that contains the debug_mode parameter.
- Go to your GA4 property and click on Admin> DebugView from the left menu.
- You should see your event coming into DebugView in real time.
How to Use DebugView in GA4?
Once you have enabled DebugView in GA4, you can use it to debug your data collection and processing in real time. Here are some tips and tricks on how to use DebugView effectively:
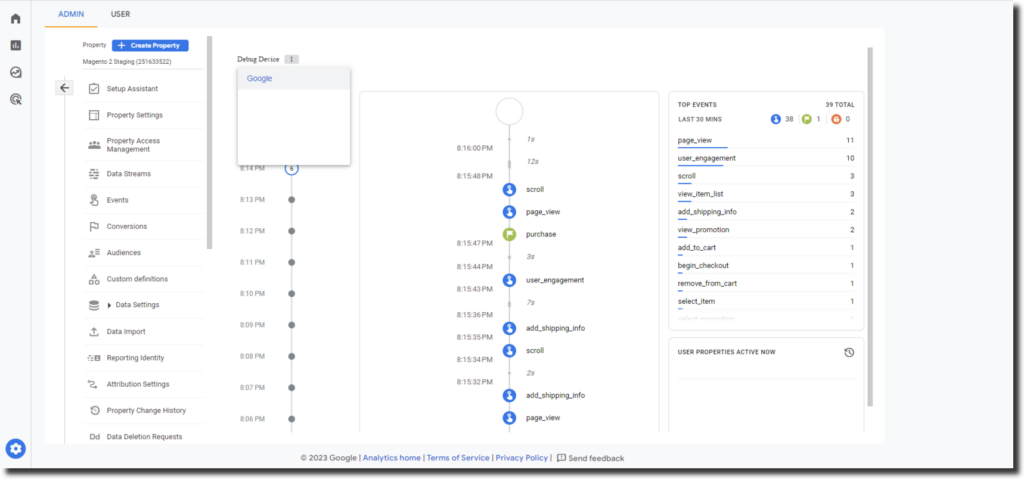
• Use the Device Selector dropdown menu at the top of DebugView to filter the data by device or platform. You can also use the search box to find a specific device by name or ID.
• Use the Event Selector dropdown menu at the top of DebugView to filter the data by event name or category. You can also use the search box to find a specific event by name or parameter value.
• Use the tabs at the bottom of DebugView to switch between different views of the data: Events, User Properties, Errors, Conversions, Audiences, etc.
• Use the icons
Debug Magento 2 Google Analytics 4 Tags with Google Tag Assistant Extension
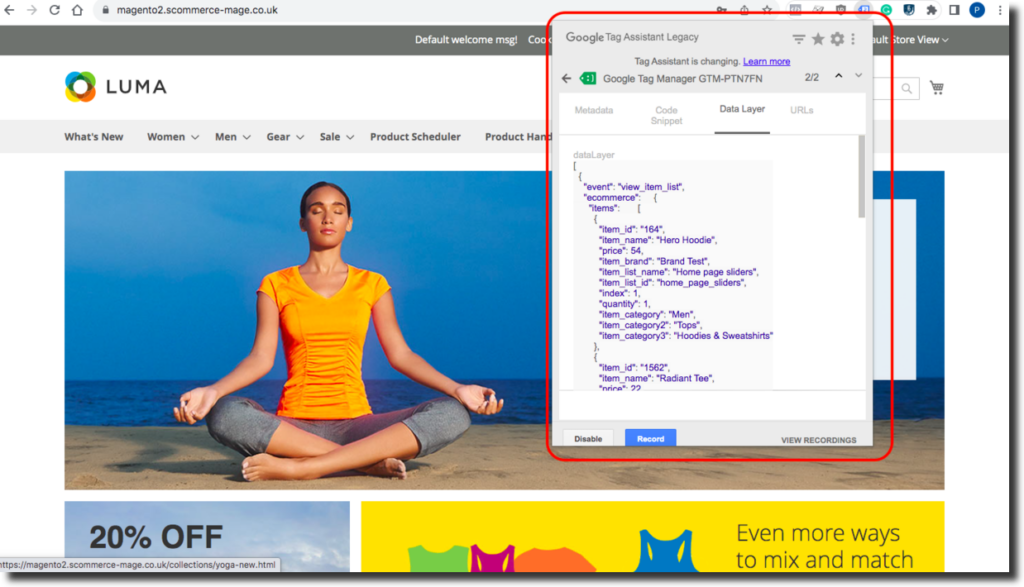
Another option for debugging GA4 tags on your website is to use the Google Tag Assistant Extension. This is a browser extension that helps you validate and troubleshoot the implementation of various Google tags, such as Google Analytics, Google Tag Manager, Google Ads, etc.
The Google Tag Assistant Extension can help you debug GA4 tags by showing you:
• The status and details of the GA4 tags that are detected on your website
• The events and parameters that are sent by the GA4 tags
• The errors or warnings that are related to the GA4 tags
• The suggestions and tips on how to improve your GA4 implementation
To use the Google Tag Assistant Extension for debugging GA4 tags, follow these steps:
- Install the Google Tag Assistant Extension from here.
- Click on the extension icon to enable it (you should see a blue tag icon).
- Navigate to your website and interact with it as a normal user.
- Click on the extension icon again to open the Google Tag Assistant panel.
- You should see a list of the Google tags that are detected on your website, including GA4 tags.
- Click on a GA4 tag to see more details about it, such as its ID, status, events, parameters, errors, warnings, suggestions, etc.
- You can also click on the Record button at the top of the panel to record a session of your interactions with your website and see how the GA4 tags behave during that session.
- You can also click on the Share button at the top of the panel to generate a report of your Google Tag Assistant session and share it with others for further analysis or troubleshooting.
Debugging GA4 Data Layers with Browser Console
Another option to debug Magento 2 Google Analytics 4 is to use the browser console for debugging GA4 data layers on your website is to use the browser console. This is a tool that allows you to inspect and interact with the elements, scripts, and network requests on your website.
The browser console can help you debug GA4 data layers by showing you:
• The structure and content of the data layer objects that are pushed by your website or GTM
• The values and changes of the data layer variables that are used by your GA4 tags
• The errors or warnings that are related to the data layer or GA4 tags
To use the browser console for debugging GA4 data layers, follow these steps:
- Open your browser and navigate to your website.
- Right-click on any blank area of your website and select Inspect or Inspect Element (depending on your browser).
- A new panel will open with various tabs and tools. Select the Console tab.
- You should see a list of messages, errors, warnings, etc. that are logged by your website or GTM.
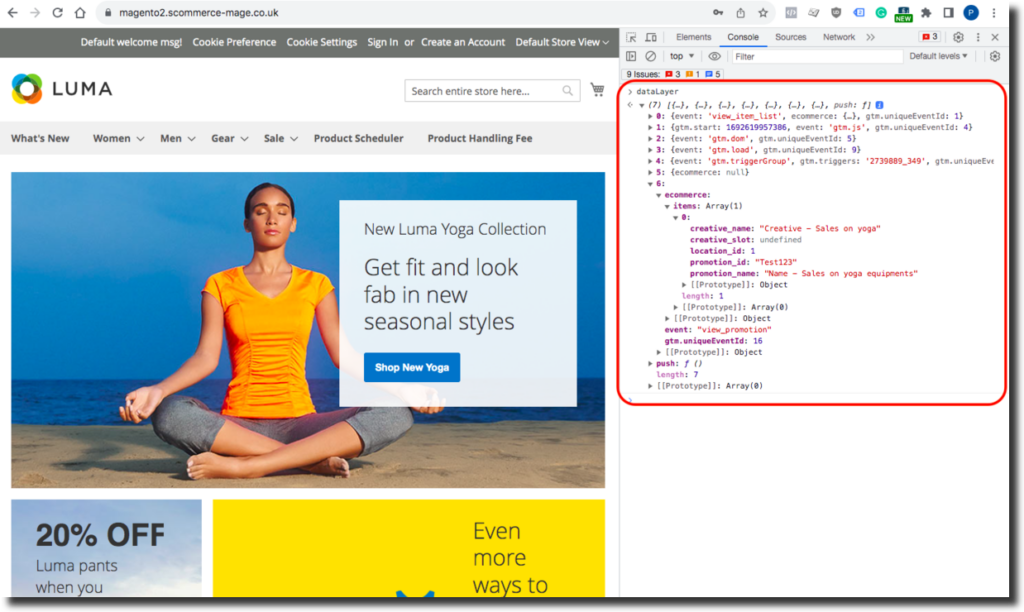
- To see the structure and content of the data layer objects that are pushed by your website or GTM, type dataLayer in the console and press Enter. You should see an array of objects that represent the data layer events and parameters.
- To see the values and changes of the data layer variables that are used by your GA4 tags, type dataLayer.get(‘<variable_name>’) in the console and press Enter, where <variable_name> is the name of the data layer variable that you want to check. You should see the current value of that variable.
- To see the errors or warnings that are related to the data layer or GA4 tags, look for any red or yellow messages in the console that mention dataLayer or gtag. You can also filter the messages by typing dataLayer or gtag in the filter box at the top of the console. You should see the details and sources of the errors or warnings.
Real-Time Reports
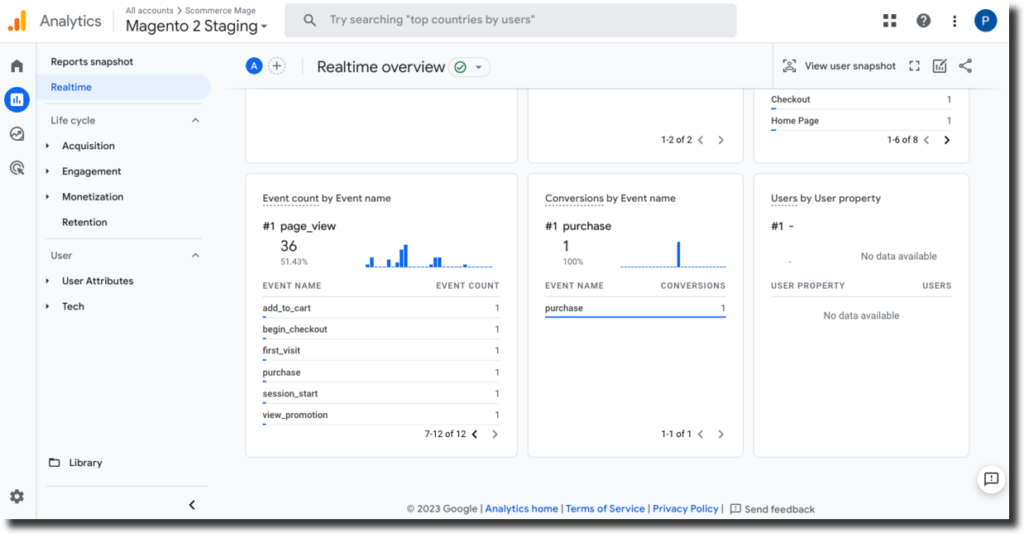
Real-time reports in GA4 are one of the easiest methods to debug Magento 2 Google Analytics 4. It displays all the events that are coming through to the analytics and it can also help you see the purchase event with transaction ID using which you can identify whether the order placed has been received in GA4 or not. As we know either real-time reports or debug view, are the only ways to verify a transaction in real-time. Google Analytics 4 takes 24 to 48 hrs to populate data into all reports hence we can only wait for the time period to view the transactions in various other reports which delays the testing time. For rapid testing, Real-time reports/ debugView can be utilized. You can use this report by following the steps below:-
- Go to your Google Analytics 4 property
- From the left menu navigate to Reports then from the following menu select Realtime
- You can check all the GA4 events incoming from your store in real time.
- Click any event to see more data that gets received with it for example, you can click on the Purchase event and then ‘transaction_id’ to verify the transactions are sent after placing orders.
Conclusion
In this blog, we have learned how to debug Magento 2 Google Analytics 4 using various methods and tools. We have seen how to use the Google Tag Assistant extension, the Google Analytics Debugger extension, the Console tab in the browser’s developer tools, Real-Time reports in GA4 and the DebugView feature in the Google Analytics 4 interface. These methods and tools can help us to verify that our Google Analytics 4 implementation is working correctly and to identify and fix any errors or issues that may arise.
Debugging Google Analytics 4 in Magento 2 is an important step to ensure that we are collecting accurate and reliable data from our website. By following the steps and tips in this blog, we can troubleshoot our Google Analytics 4 setup and optimize our website performance and user experience. Our recommendation is to also learn about “Transactions Reports” which is a very powerful tool that can help you debug your setup as you used to in Universal Analytics. We have talked about these reports in detail in the blog post given below. We hope you found this blog helpful and informative. If you have any questions or feedback, please feel free to leave a comment below or contact us through our website. Thank you for reading!


