There has been plenty of chin-scratching about how the pandemic changed the way we interact with the internet, and how that may change again as the pandemic recedes. At one point, we were assured that the pandemic was “accelerating the digital transformation.” Now maybe we’re not so sure.
But here’s another way of looking at it: If you went to sleep at the beginning of 2020 and just woke up now, things would be pretty much where you think they would be: We’re still glued to our digital devices, only more so.
We could write more about this. But sometimes pictures — or in this case, charts — do way better than words. Let’s take a quick survey of how we’re spending our time online, what’s changed, and what that means.
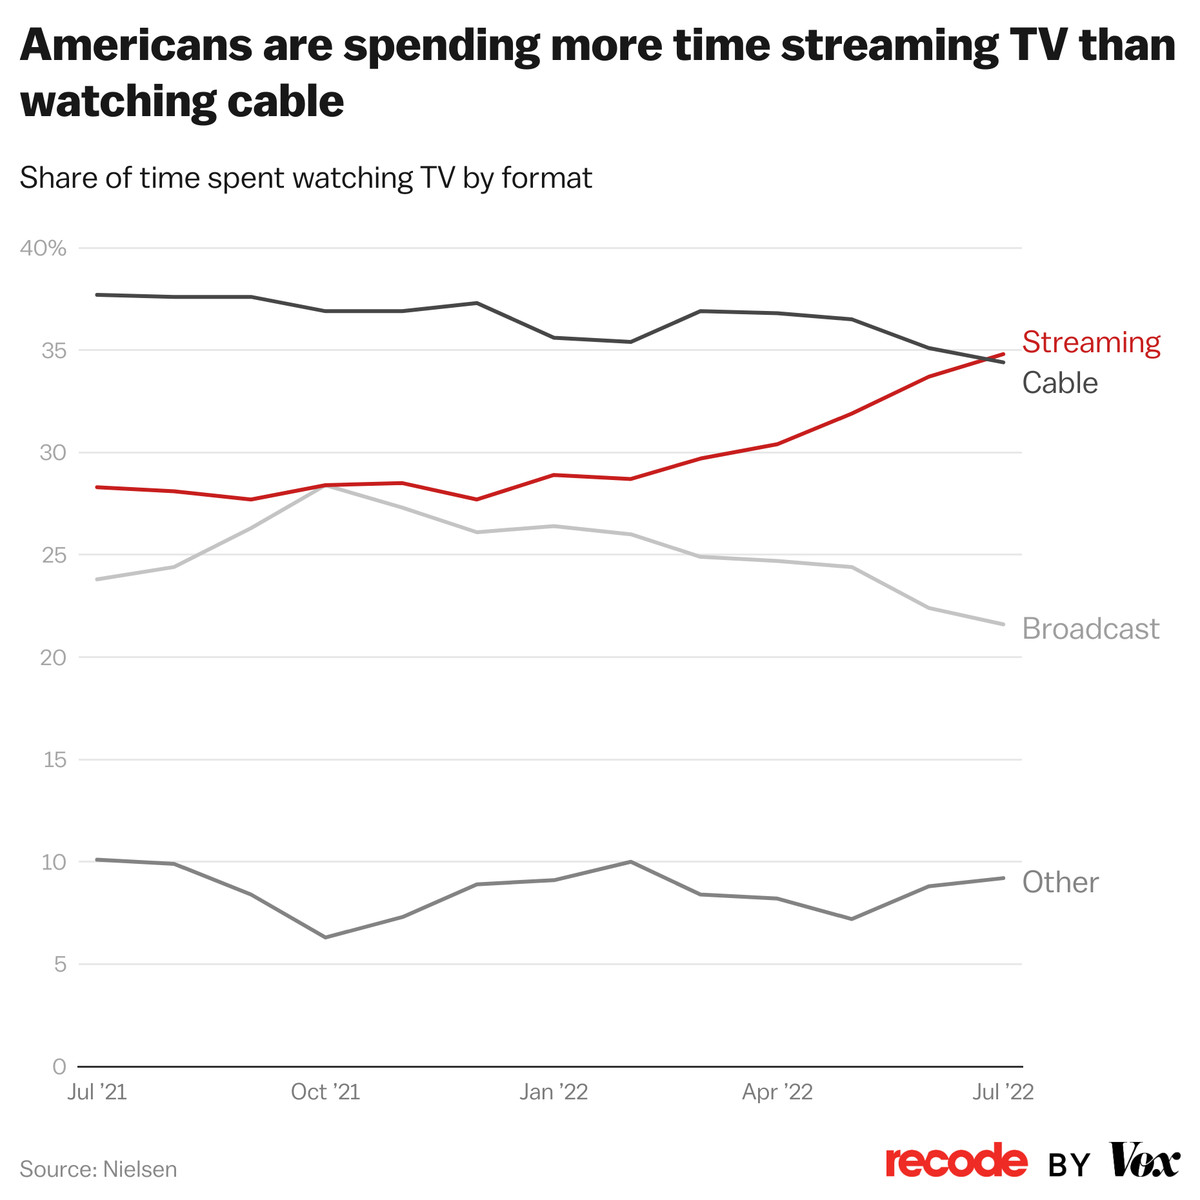
This summer, for instance, marked a major milestone for the streaming video world: It’s the first time, per Nielsen, that Americans watched more streaming TV than cable.

It’s possible, by the way, that this chart will move around a bit this fall when traditional TV networks will trot out their new shows (in streaming, new stuff comes on the screen all the time). But it’s a reminder that the streaming genie is never going back in the bottle, even if big media companies and their investors might like that. The trick is figuring out how to make money off of streaming — something Netflix is just getting around to doing, and some of its new competitors, like Disney and Warner Brothers Discovery, now have to do as well.
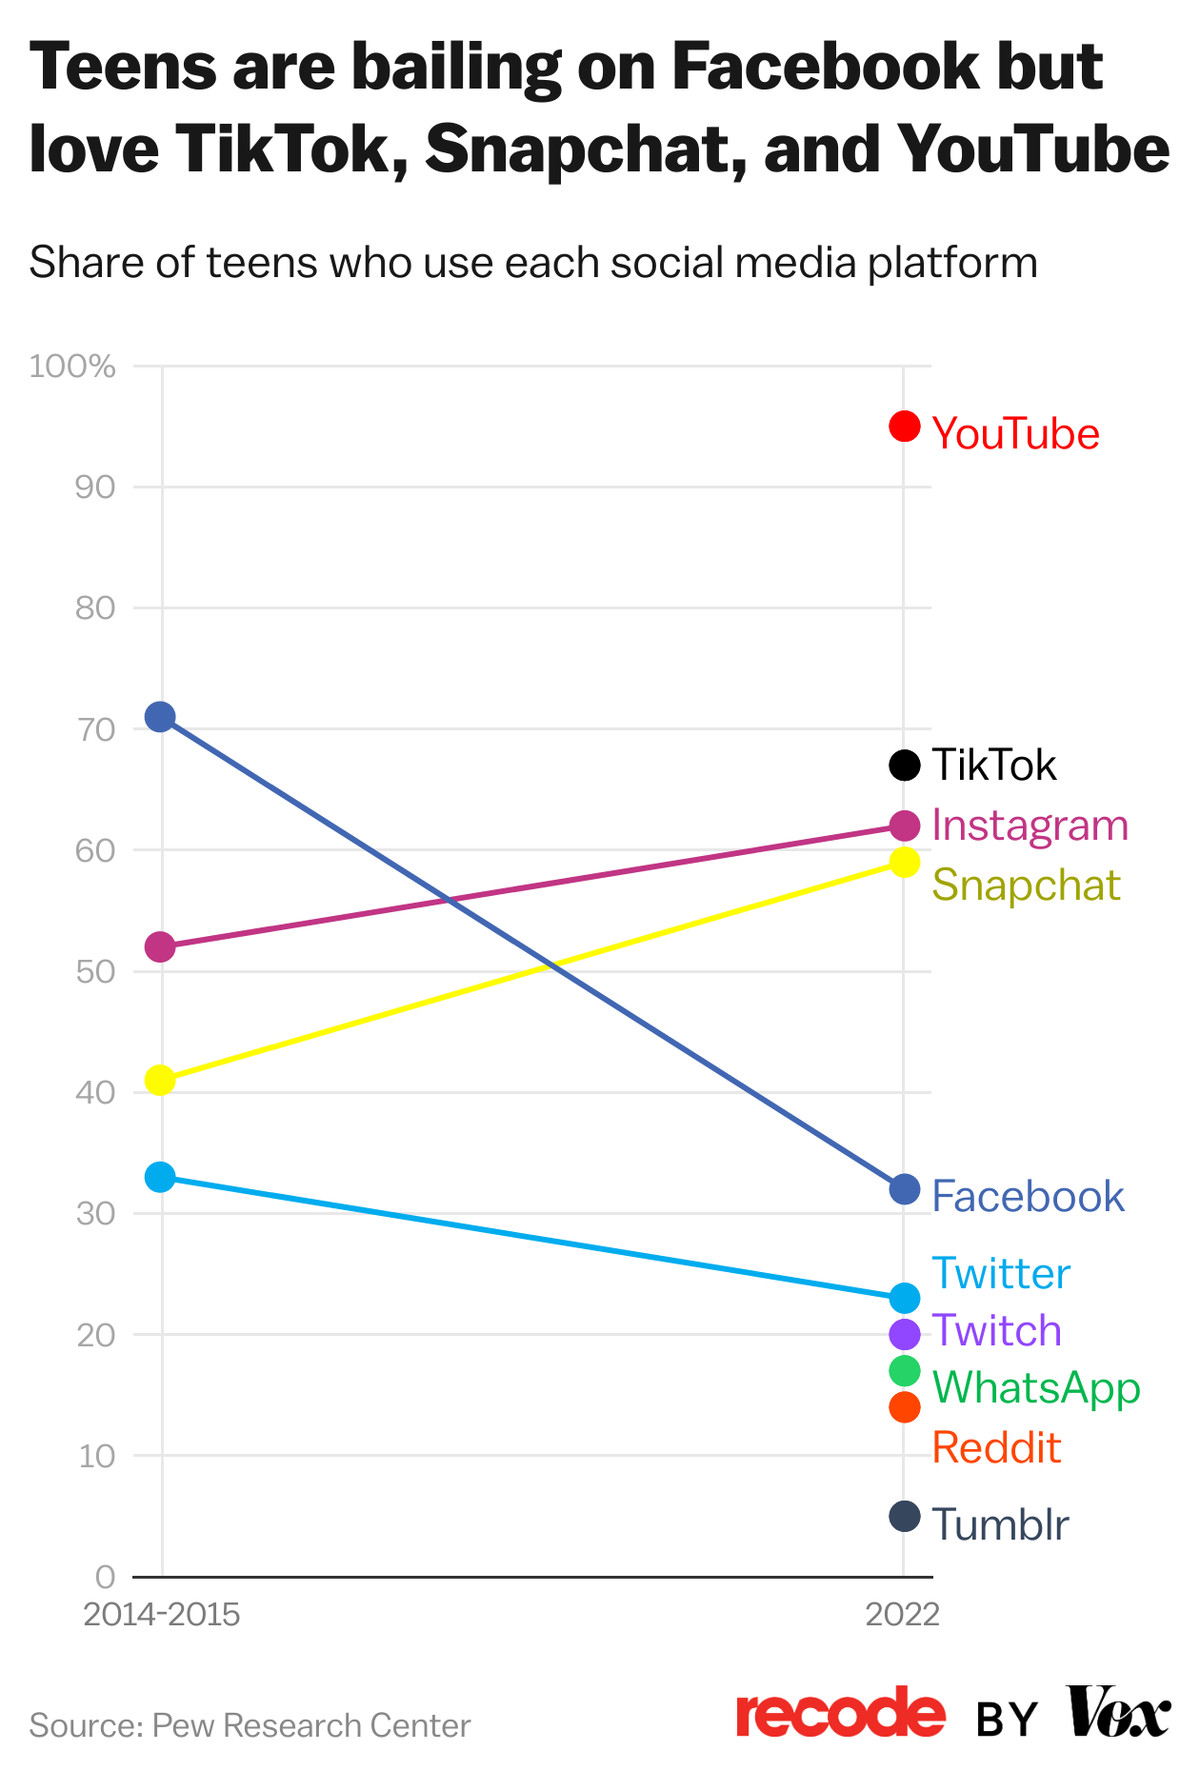
The company formerly known as Facebook, meanwhile, makes plenty of money — Meta recorded nearly $40 billion in profits in 2021 — but users are another story. Growth at all of its apps is slowing, and the original Facebook service actually lost users at the end of last year before bumping up again the following spring.

If you’re a regular reader of this column, you know that TikTok has become a major problem for Meta — one the company often points out, and one that it’s trying to solve by making its apps more like TikTok. But Facebook has another longstanding competitor in YouTube, and just because the world’s biggest video service doesn’t get that much attention from the press doesn’t mean it’s not … the world’s biggest video service. Which is why it remains enormously popular for the young internet users Facebook would like to attract again.
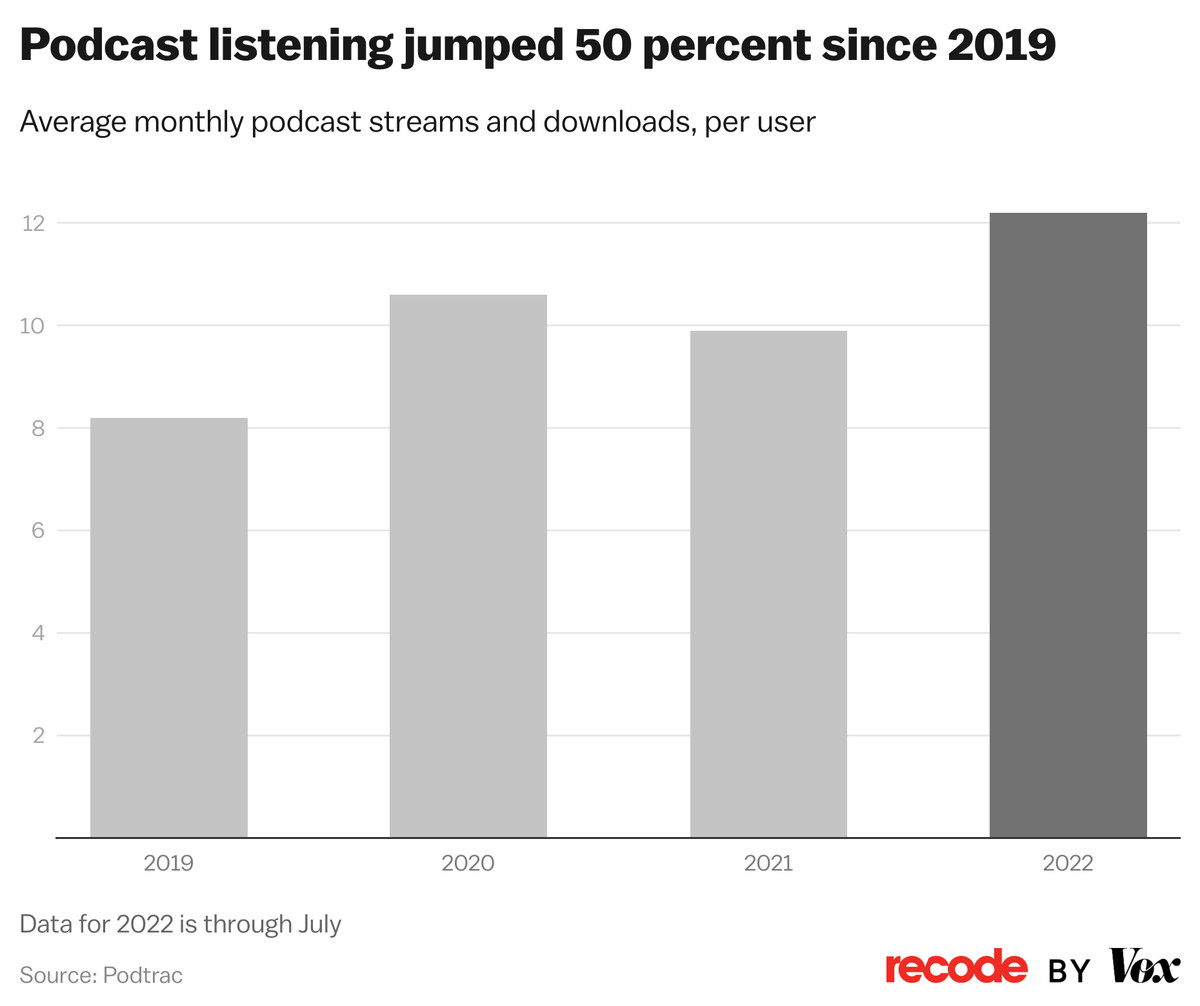
And last, a chart that admittedly has specific appeal to the authors of this story, since we’ve both made podcasts for a living: Turns out that people who like podcasts continue to like podcasts, and that their interest in podcasts has continued to grow no matter what’s happening around them. Important note: This data from measurement service Podtrac doesn’t tell us if the number of people who consume podcasts is growing, and there really isn’t great data for that. One decent proxy, though: Spotify, which has spent an enormous amount of money on its podcast strategy, says its number of podcast listeners has continued to grow.


